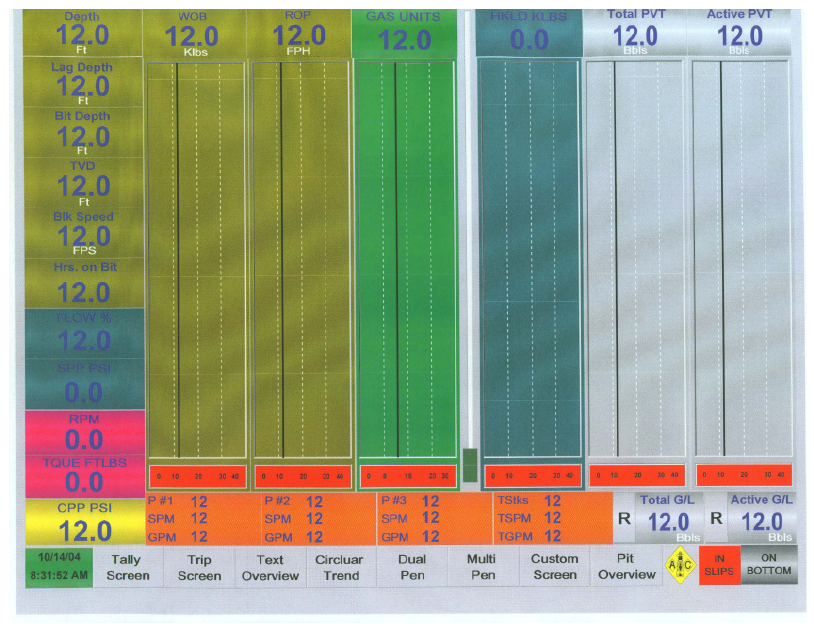
This is the Graph Overview. This screen has six graphs that are preset. The scroll rate and scales are easily set, by double clicking on the graph, as are the alarm set points by clicking on the block. When an alarm is active the block of the parameter turns red and the display flashes. It also has a scrollback button to view previous data.